
Simpson's Paradox
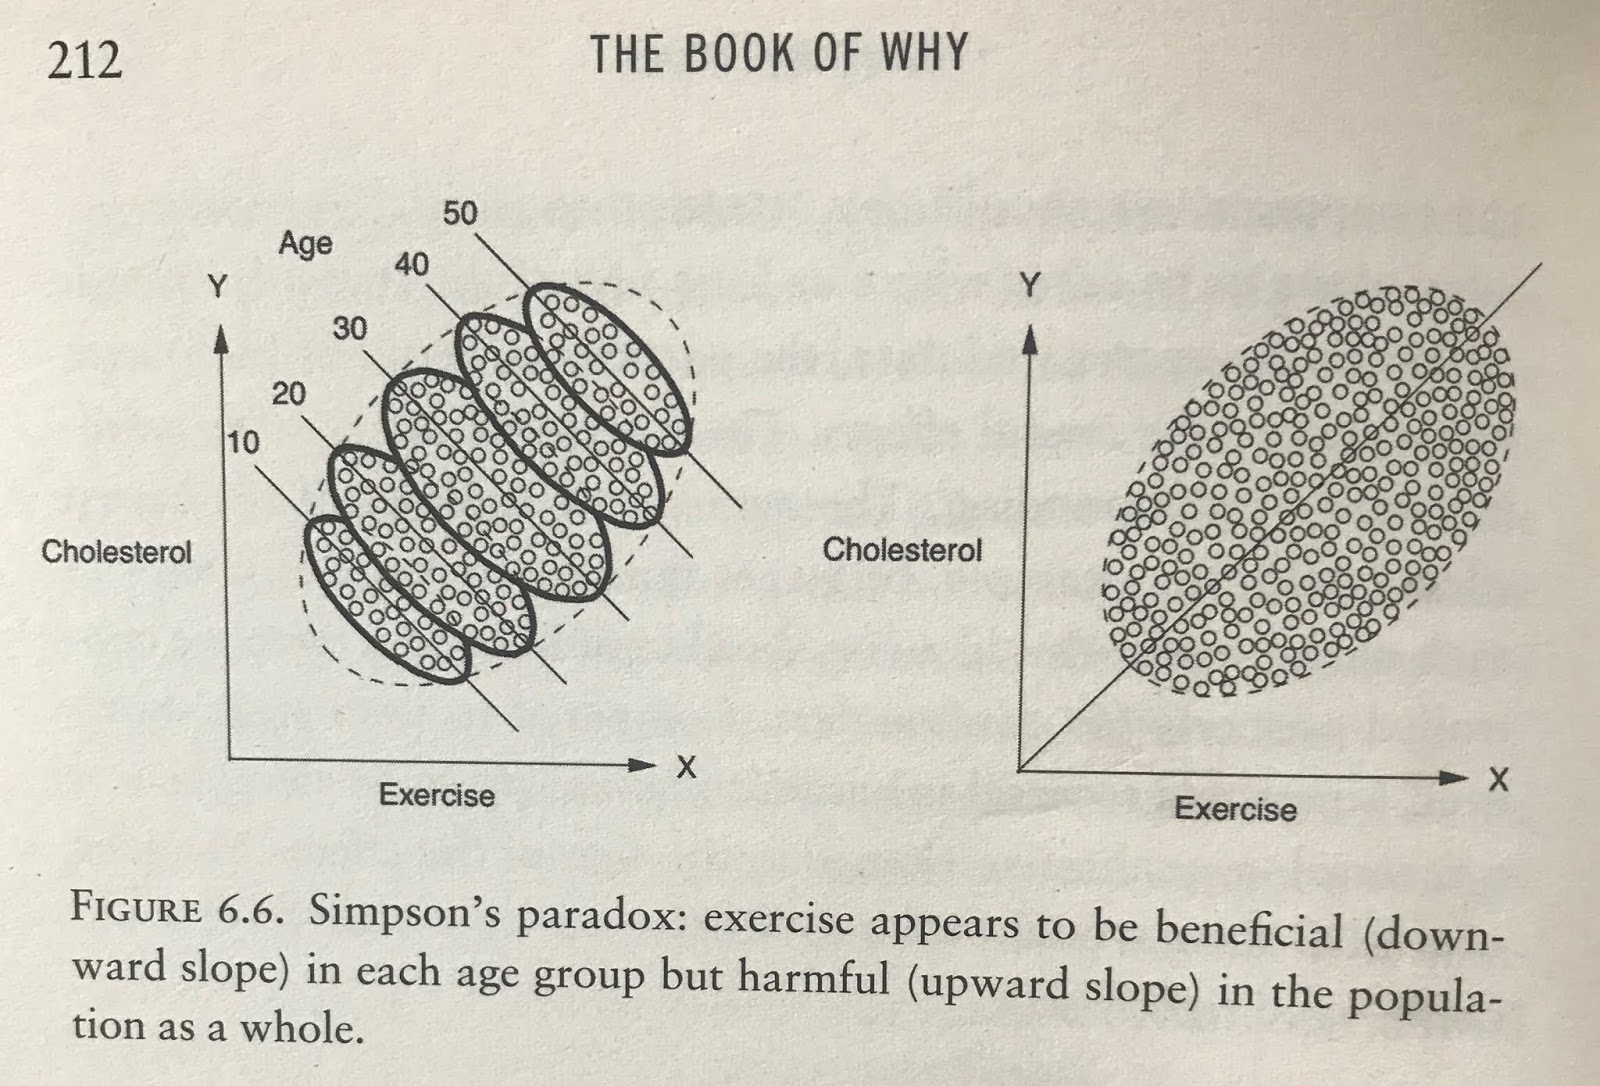
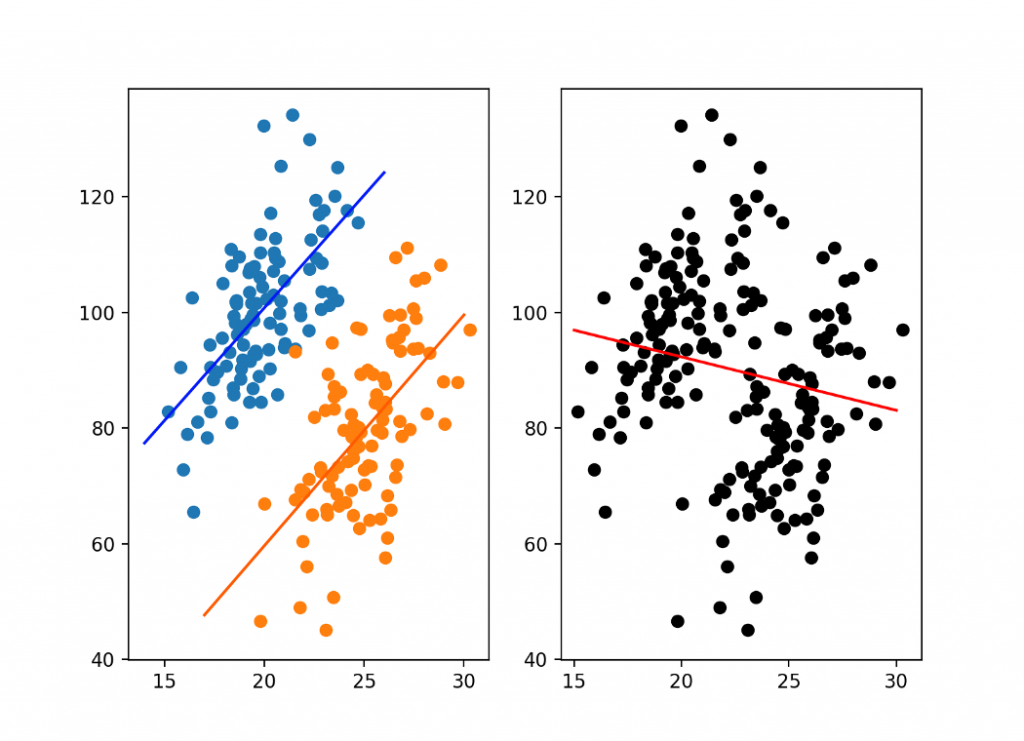
09 October 2021, 4 mins readThe Simpson's Paradox is one statistical concept that can be used to explain misinterpretation of data. It involves the aggregation or disaggregation of data to show the reversal of interpretation. For example, the audience may agree that the aggregated data has a positive correlation, but when broken down by demographics such as age, household income, or other metrics, such as location, temperature, the audience sees a reversal of interpretation, i.e. negative correlation, or vice versa. This is usually due to the fact that the aggregated data hides a conditional variable.
Even though correlation and causation can exist at the same time, it is important not to assume that correlation implies causation and therefore, we need to look beyond statistics and understand the situation behind.
Simpson's Paradox is used in a lot of fields, such as medical trials, sports statistics, elections (Gerrymandering), etc. This paradox has also been used to compare the COVID-19 fatality rates among countries, the result has shown that even though some countries have high fatality rates than others, they have lower fatality rates when the demographic is broken down by age, as these countries have higher proportion of older patients.
Example
We can use a simple college admission example. I am using an extreme range to make this example easier to be understood.
Suppose we have two schools, School A and School B, with equal number of applicants, 105. The table below shows the number of successful admissions and their percentages.
| School A | School B | |
|---|---|---|
| # of Applicants | 105 | 105 |
| # of Successful Admissions | 98 | 55 |
| Admission Rate (%) | 93.3% | 52.4% |
From the table above, it is clearly known that School A has a far higher admission rate than School B.
Now, the table below shows the disaggregated data of male and female applicants in School A and School B. The fraction is shown as [number of successful admission] / [total applicants] (% of successful admission).
| School A | School B | |
|---|---|---|
| Male | 1 out of 5 (20%) | 50 out of 100 (50%) |
| Female | 97 out of 100 (97%) | 5 out of 5 (100%) |
| Total | 98 out of 105 (93.3%) | 55 out of 105 (52.4%) |
When the data is disaggregated as above, we can observe a totally opposite interpretation. School B has higher admission rates for both male and female.
It is observed that if an applicant, doesn't matter male or female, wants to be admitted into a school, any school, they will have a higher chance if they apply to School B. However, when the data is aggregated, we see that School A has a far higher rate of admission than School B.
On the other hand, if the interpretations before and after disaggregation are the same, then Simpson's Paradox is invalid.
Therefore, Simpson's Paradox can help statisticians in understanding the role of data in causal inference and to assist in decision-making.